How to view my RPC requests latency
Have a general idea of the performance of your RPC requests over time.
When evaluating your RPC request performance, it's important to look into individual methods as well as p50/p90/p99 percentiles.
Ironforge, based on your request, provides you with a graph that allows you to view this information in detail.
To view this information:
- Access your preferred project.
- Click on analytics on your left hand sidebar.
- At the top of the analytics page, choose your preferred cluster and time interval.
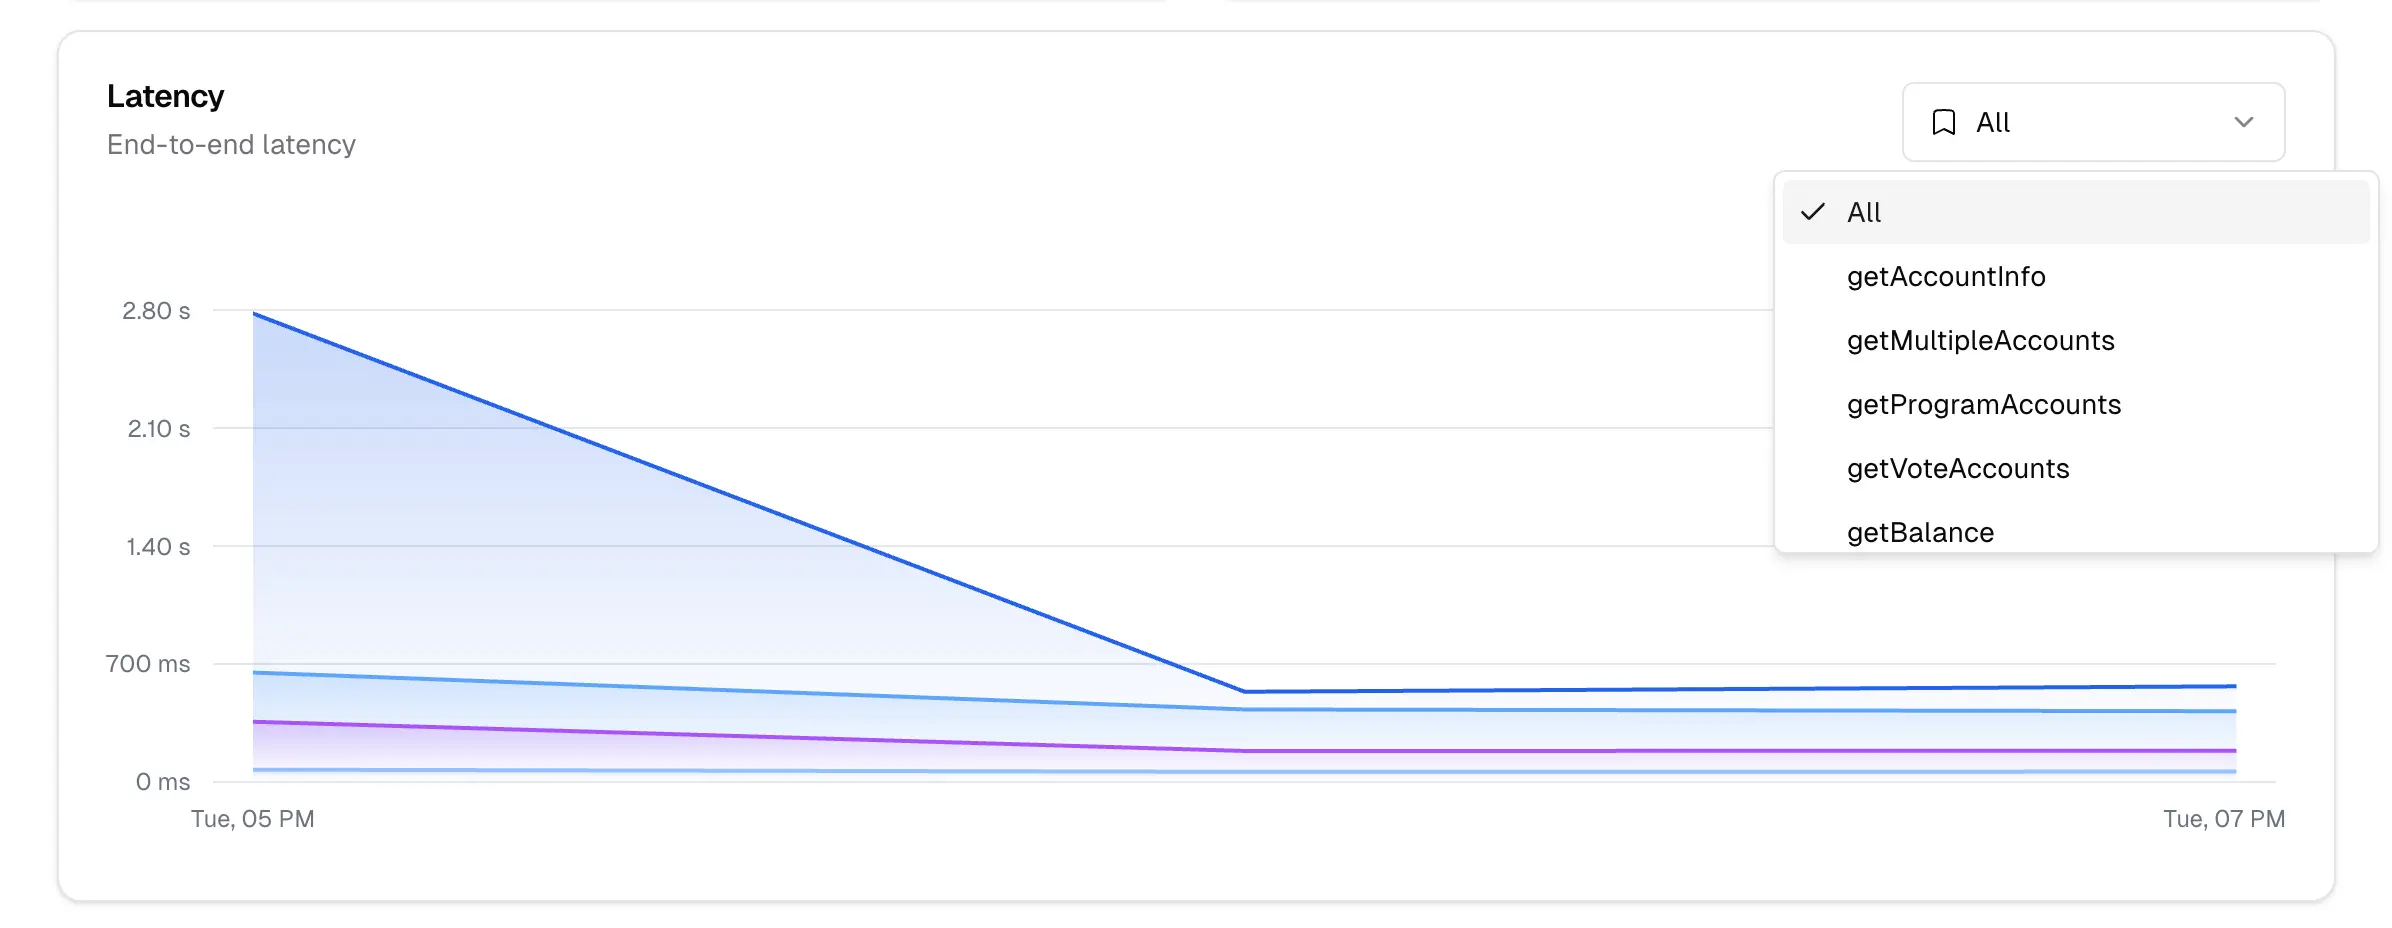
- Scroll through the graphs and search for the latency graph.
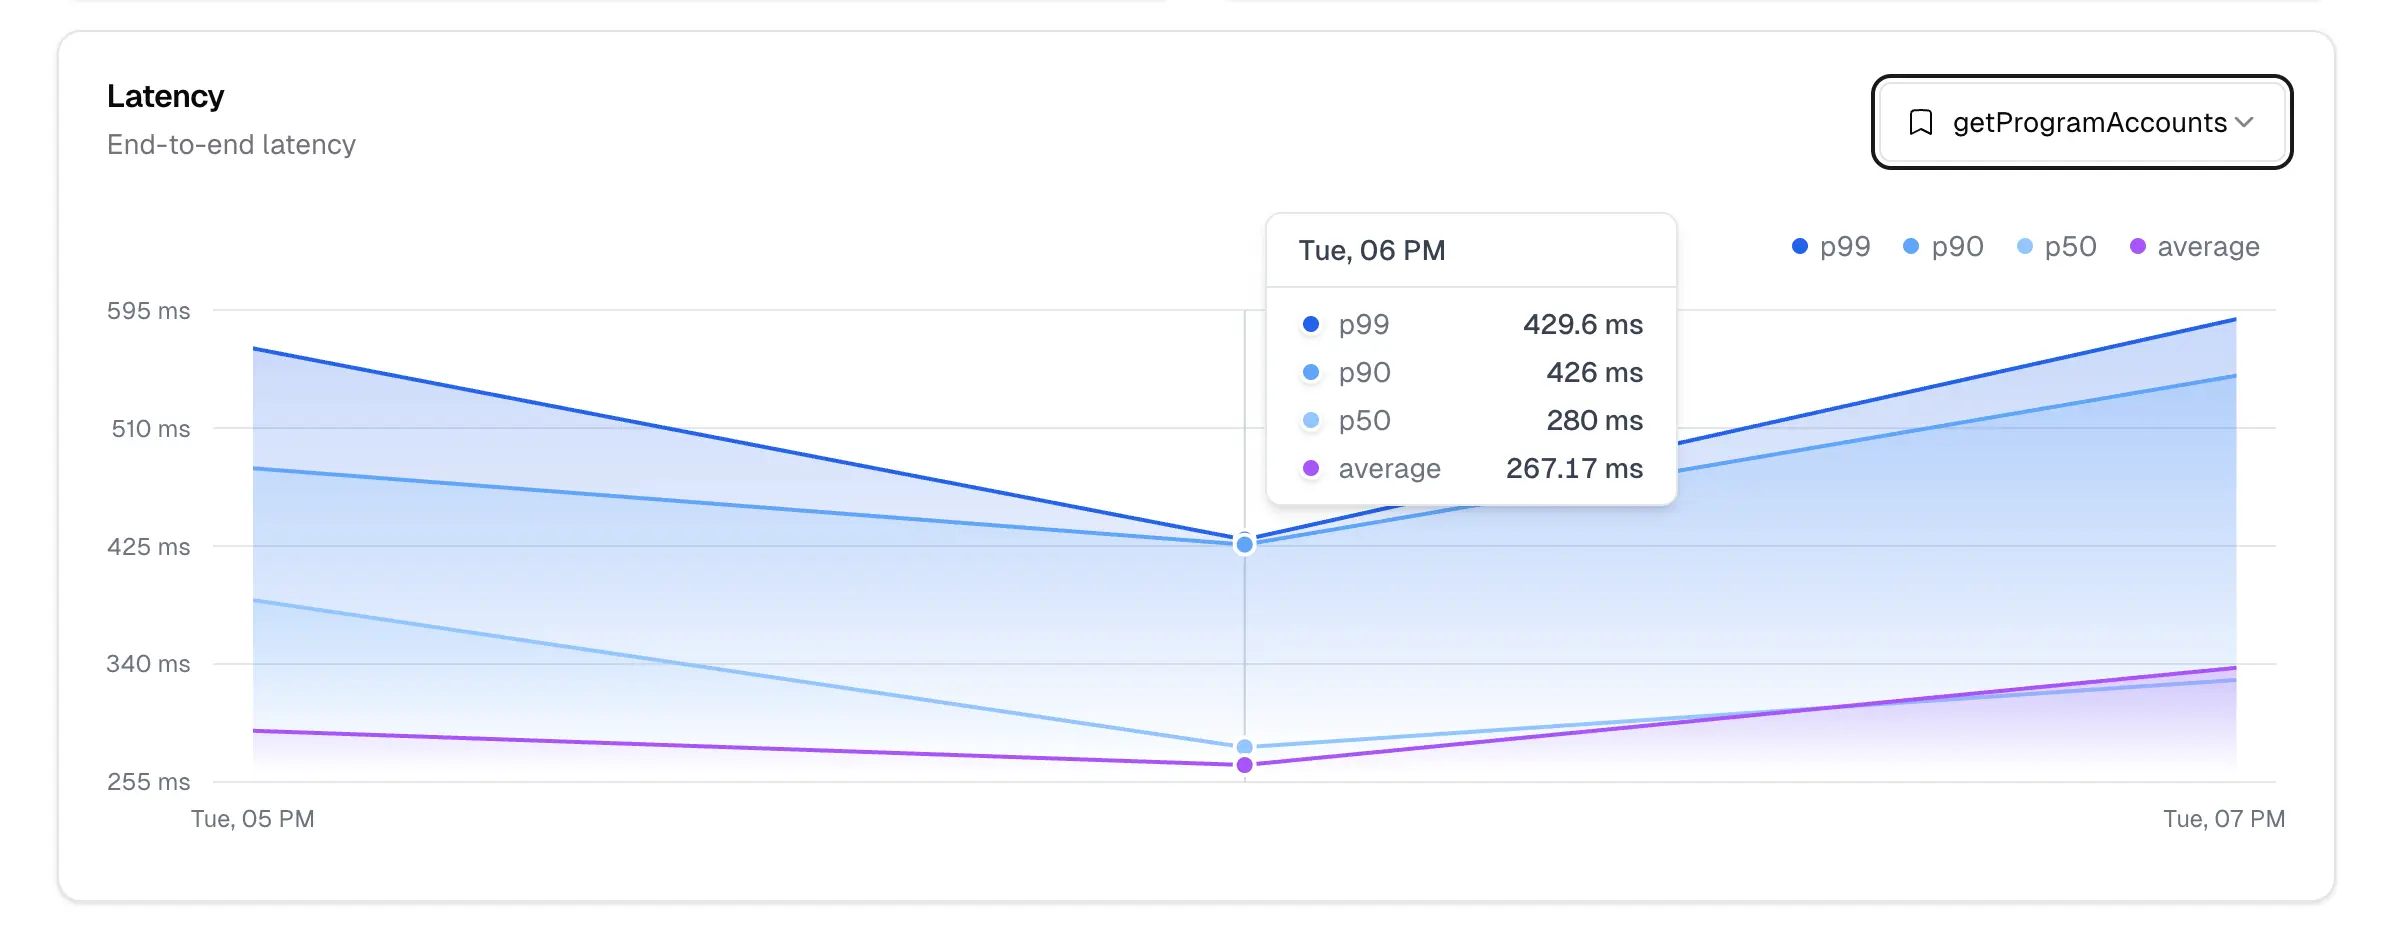
- Click on the upper right dropdown button for filtering methods.
- Hover over the graph and analyze the purple line in the graph.
Ironforge Support
If you are experiencing issues while following the steps, please contact us on Discord or via Twitter at @IronforgeCloud. We will be happy to help you.